Antimicrobial Dashboard

Project phases
The University of British Columbia (UBC) Department of Medicine improves the ability to assess infection when prescribing antimicrobials by visualizing the data more efficiently.
Antimicrobials are an important and frequently-utilized class of medications and their accurate prescription results in better patient outcomes and decreased antimicrobial resistance. When prescribing antimicrobials, a clinician will assess multiple sources of data from within a patient’s EHR and cognitively assemble and integrate these disparate sources. This process is taxing, error-prone, and an example of how the EHR (electronic health record) user experience can lead to clinician burnout.
Overview
The UBC Department of Medicine partnered with the University of British Columbia Cloud Innovation Centre to create a prototype enabling clinicians to efficiently prescribe antimicrobials. This prototype enables clinicians to efficiently view multiple data points for an integrated assessment on what antimicrobial therapy to prescribe for a given infection. This data is visualized in a dashboard that allows the clinician to make efficient and accurate clinical decisions with an improved user experience.

Today, clinicians who use the Electronic Health Record and prescribe antibiotics have to navigate the EHR to assemble and act on multiple data points. This process is time-intensive and requires substantial effort to determine the appropriate antimicrobial treatment for their patient. This is a complex process requiring cognitive integration of many pieces of the patient’s health data.
This data is currently represented in disparate regions of the patient’s EHR and not presented in the clinical context of assessing and treating infection. Some clinicians may draw out a timeline manually on paper with key clinical events, culture sensitivities, and antibiotics the patient has received. In order to make an accurate assessment and make the best decisions for their patient, clinicians must spend time clicking through to different parts of the patient chart.
The relevant clinical information is documented but not readily available when treating infection. For example, in this process a clinician may access a patient’s culture results, previous antimicrobial therapy, vital signs, labs, imaging, allergies, institutional antibiogram data, and clinical guidelines. This same inefficient process has to be repeated each time this clinical scenario is encountered.
Approach
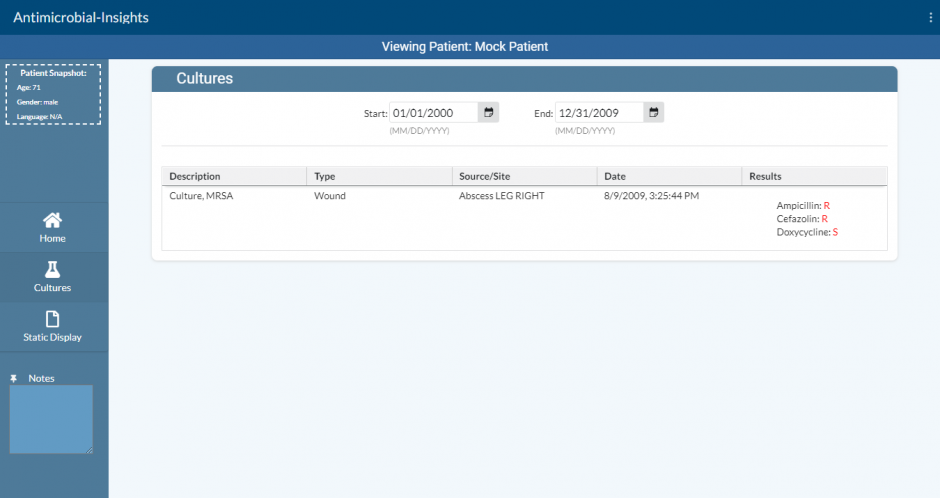
To solve this problem, the visualization tool gathers all the clinical data used when prescribing antimicrobials into one place. Its visual design will increase both the effectiveness and efficiency of the clinician’s decision making process when prescribing antimicrobials. It gathers the patients’ laboratories, previous culture results, allergies, medications, and other data points and presents them visually with a user experience that streamlines the effective prescription of antimicrobials.
The prototype solution takes the form of a visual dashboard that displays all of the necessary information. This provides a better user experience for clinicians, which leads to improved patient care and decreased clinician burnout. By improving the user experience, clinicians can more efficiently and accurately prescribe appropriate antibiotics for bacterial organisms, reducing both the amount of time spent navigating systems and the cognitive load on clinicians.
Link to solution on GitHub: https://github.com/UBC-CIC/antimicrobial_app_smart_fhir
Supporting Artifacts
FAQs
Q: What kinds of context will these visualizations be representing?
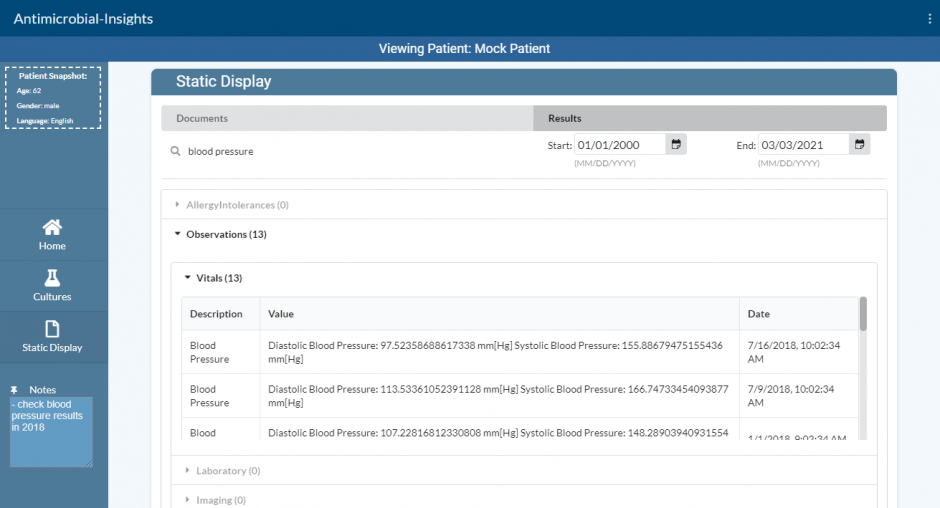
A: Patient laboratory results such as white blood cell count, C-reactive protein, vital sign measurements such as blood pressure and temperature, previous culture results, allergies, medications, and other data points that are clinically meaningful in antimicrobial prescribing.
Q: What will the learning curve be like for this app?
A: The app utilizes design principles familiar from other web applications and EHRs and will be plug and play for most EHR users.
Q: How will the app know what variables to add to the data visualization?
Many EHRs now support the FHIR API. This ‘FHIR API’ specifies standards so that across different platforms, variables are referred to in the same way. For example, this ensures that when one EHR refers to temperature, this will be completed in the same way as another EHR, and as well as the SeeID app. This requires the EHR to support a FHIR API.
Q: How do I get started using this app?
Once your local EHR vendor supports the FHIR API and the ability for applications to be run on top of it, then you will be able to add SeeID as an application.
Technical Details
Healthcare providers often have to navigate many disjoint pages in an EHR to view relevant data about a patient. This takes time and can be inconvenient, so a solution was required to help streamline the data retrieval and visualization process. This solution consists of two main parts.
Interface with SMART on FHIR compliant EHR servers
- Using the SMART JS Client library, the solution requests authorization from the EHR server. The solution needs to be registered with the EHR server prior to use, and the unique Client ID must be specified in the src/index.js file for successful authorization.
- The following scope permissions (specified in the src/index.js file) are required for the successful launch of the solution: patient/Observation.read, patient/Procedure.read, patient/Patient.read, patient/AllergyIntolerance.read, patient/MedicationRequest.read, patient/DiagnosticReport.read, patient/ServiceRequest.read, launch, profile, openid, online_access
- After successful authorization with the EHR, a FHIR client instance is initialized within the context of the current patient. The solution then launches and starts loading.
- The FHIR client is then used to query patient information from the following FHIR Resources on the EMR server:
- Patient [patient personal details], Observation [lab data, vitals, imaging, social history, clinical assessment], Procedure [operations, counselling], AllergyIntolerance [allergies, intolerances], MedicationRequest [prescriptions], DiagnosticReport [laboratory, pathology, imaging], ServiceRequest [record of a procedure or diagnostic request].
Filtering and processing patient data for visualization
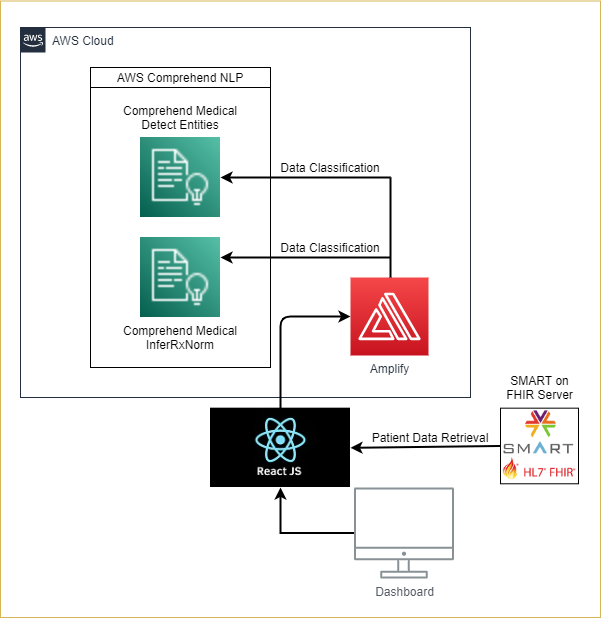
- The solution checks the medication data (from the Medication resource) for any RxNorm codes (RxCUIs). If it exists, it goes through a series of checks using the RxNav API to retrieve the corresponding ATC, MeSH, and FMTSE codes to identify if the medications are antibiotics or not. MeSH codes are checked using the UMLS API.
- If no RxNorm codes exist for the medication, it then gets transmitted to the AWS Comprehend Medical Detect Entity API for analysis to extract the medication name from the prescription. After which, the result is sent to the AWS Comprehend Medical InferRxNorm API to identify a corresponding RxNorm code (RxCUI). After which, it goes through the same identification process as above.
- The solution filters out any non-medication allergies (from the AllergyIntolerance resource) by checking the category field of the entry. If the category field does not exist, the allergy description is run through the AWS Comprehend Medical Detect Entity API to determine if it contains a medication.
- The solution filters out entries from the Observation resource and checks the code field to determine the type of data it contains. The solution then matches the code against a list of relevant SNOMED or LOINC codes to determine the data type (blood pressure, heart rate, etc.).
General Design
The solution was designed as a web application using the ReactJS framework.
The web application is integrated with AWS Amplify, and it provides the application with user authentication capabilities via AWS Cognito.
User authentication/login can be removed from the application if desired for production usage.
Architecture Diagram
Acknowledgements
Dr. Daniel Raff – UBC Family Medicine Resident
Dr. Jesse Tinker – UBC Internal Medicine Resident
Dr. Anita Palepu – Head of the UBC Department of Medicine
“stethoscope” by jasleen_kaur is licensed under CC BY-SA 2.0
About the University of British Columbia Cloud Innovation Centre (UBC CIC)
The UBC CIC is a public-private collaboration between UBC and Amazon Web Services (AWS). A CIC identifies digital transformation challenges, the problems or opportunities that matter to the community, and provides subject matter expertise and CIC leadership.
Using Amazon’s innovation methodology, dedicated UBC and AWS CIC staff work with students, staff and faculty, as well as community, government or not-for-profit organizations to define challenges, to engage with subject matter experts, to identify a solution, and to build a Proof of Concept (PoC). Through co-op and work-integrated learning, students also have an opportunity to learn new skills which they will later be able to apply in the workforce.