Health Platform for People on the Autism Spectrum

Today, care teams for individuals on the autism spectrum have limited and inconsistent ways to record and track variables that might trigger or serve as indicators for seizures and emotional dysregulation (meltdown) events. These variables vary from environmental changes such as temperature and carbon dioxide levels to biological factors such as changes in heart rate and heart rate variability.
In collaboration with 2m Foundation, First Place Global Leadership Institute and Pacific Autism Family Network, the UBC Cloud Innovation Centre (CIC) has developed an iOS app and web administrative application that provides care teams with a method to collect, store, monitor and access biometric and environmental information on variables that may trigger or precede a seizure or an emotional dysregulation event for an individual on the autism spectrum.
Approach
Many care teams rely on memory to manually record variables which may trigger or precede a seizure or meltdown, but these results can often be problematic for medical and education support teams unable to utilize the information for meaningful analyses, which could inform decision-making regarding treatments.
The UBC CIC team developed three major components to capture biometric and environmental information that could potentially be used in a model for predicting seizures. These components include 1) an iOS app that collects biological data via an Apple watch, 2) environmental sensors based on integrated third-party solutions; specifically Airthings and/or DIY Arduino Gas Sensors, which collect carbon dioxide (CO2) information, among other elements; and 3) a web administrative (admin) application which provides access to a centralized data lake that contains longitudinal information from the wearable devices and environmental sensors.
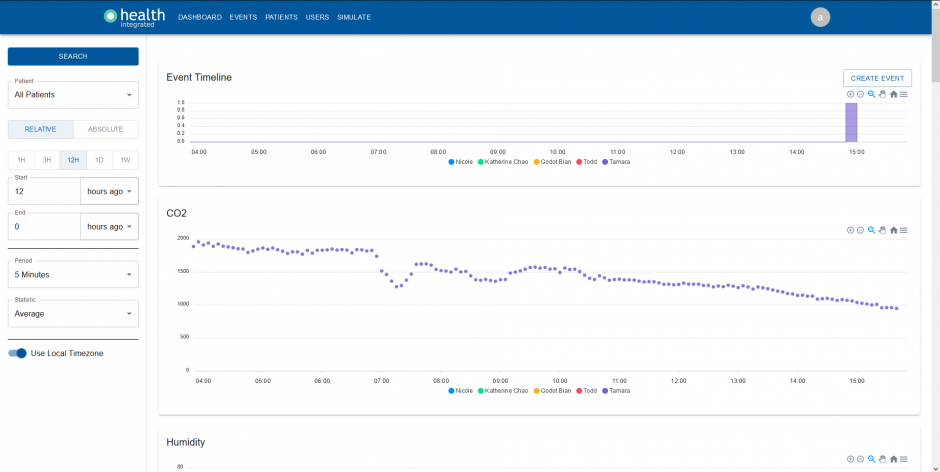
The web admin application includes functionality that displays multiple subjects’ data onto one dashboard and ensures each individual’s sensor data is mapped to the corresponding subject in the dashboard. The web interface further enables caregivers to add information and details about an individual’s event (seizure or meltdowns) to the dashboard.
Supporting Artifacts
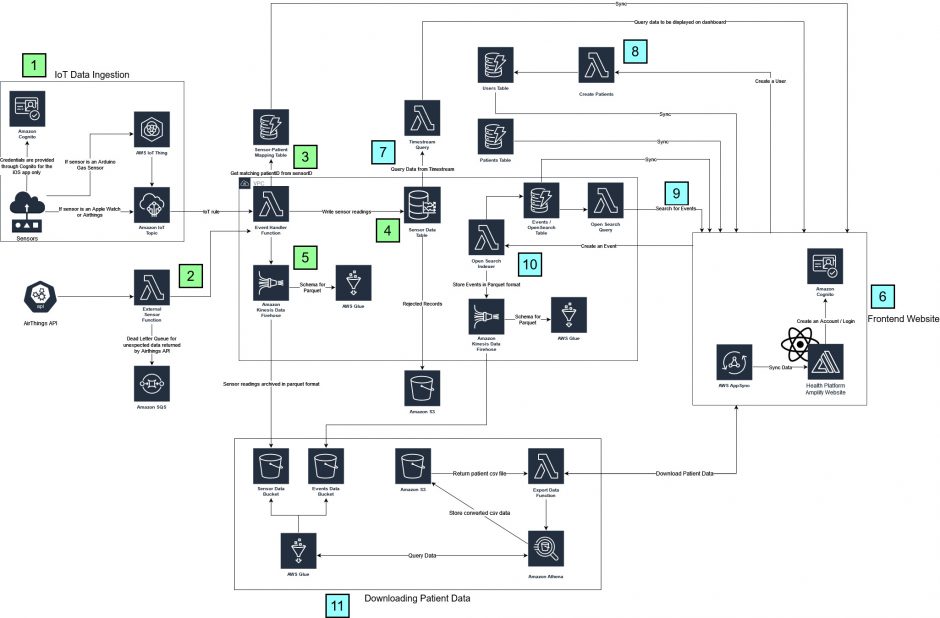
Architecture Diagram
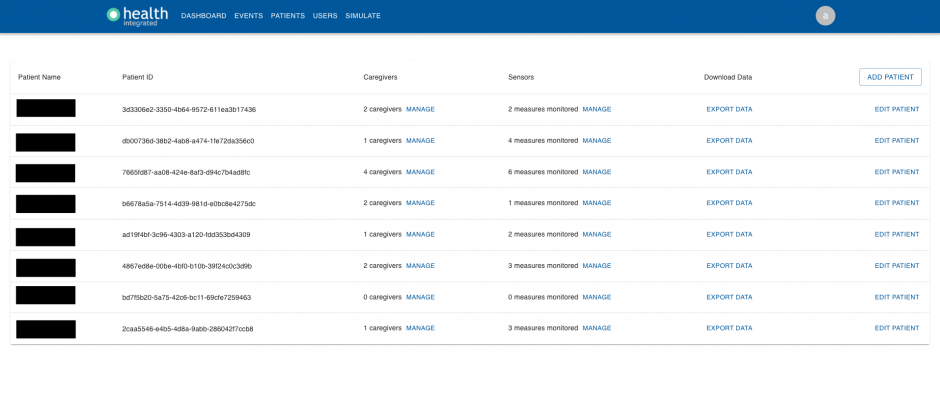
Screenshots of User Interface
Technical Details
iOS Application details:
The iOS application tracks biological data from the Apple Watch, including heart rate, heart rate variability and daily steps. Environmental data, including carbon dioxide and total volatile compounds, are collected by the Arduino Gas Sensor, while the Airthings device also collects humidity, pressure, radon, temperature, PM1 and PM2.5 readings.
To begin, sensor data flows into the Amazon Web Services (AWS) cloud via Amazon Internet of Things (IoT). While the iOS application leverages an Amazon Cognito user pool to authenticate users, the DIY Arduino Gas Sensor uses a certificate and private key to ensure authentication. Airthings API is called using a Lambda function; this authentication occurs via a token that is obtained at the Airthings integration API. Once users are authenticated, incoming data’s sensor id is mapped with the corresponding subject ID, retrieved from a DynamoDB table. The data and the matching subject ID are written into an Amazon Timestream database.
Subject data is further converted to parquet format via Kinesis Firehose, and this conversion schema is stored in a Glue table. The parquet file is saved in an S3 bucket with the path details, including data, year, month, day and hour with the associated filename, to create a data lake with the subject’s biometric information for later use.
Web Administrative details:
Users are defined as both administrators (admins) and care teams for this solution and can access and use the web dashboard. Existing users, newly created users and user information are stored in the DynamoDB users table. Admins are given permissions to 1) view dashboard events, 2) view registered subjects, 3) edit care teams, 4) assign subjects and 5) simulate data. Care teams are given permission to view dashboard events and the subjects assigned to them. Similar to the iOS application, both users are authenticated using the Amazon Cognito user pool.
The User Interface (UI) uses Amplify’s standard authentication mechanism, which asks users for their email and password. Once authenticated, care teams can register subjects and their device IDs into the system, which is stored in the respective DynamoDB tables. Should a user choose to use the search function to update the dashboard, a lambda function queries Timestream for the data based on the timeframe parameters specified by the user. This function displays the most up-to-date data for the user to see.
Events created using the website are indexed by Amazon OpenSearch so they can be searched by users later. OpenSearch is a search engine that allows users to match search keywords with event data. Once search parameters are defined, the events are retrieved from the indexed Open Search cluster and are, by default, shown in the order returned from a DynamoDB scan operation. Similar to the iOS application, the event data is converted to parquet format via Kinesis Firehose and this conversion schema is stored in a Glue table. The parquet file is saved in an S3 bucket with the path details, including data, year, month, day and hour, with the associated filename to create a data lake with the subject event data for later use.
The website functionality enables users to download all of a subject’s sensor readings. To do this, a Glue database points to the data in the Health Platform Metrics S3 bucket and Health Platform Events S3 bucket. A GraphQL query then triggers a Lambda function which invokes Athena to query the Glue database. The subject’s data is then exported to the Patient Export Data bucket and returned as a comma-separated values (CSV) file available for download through a pre-signed S3 URL link.
Link to the solution on GitHub:
Health Platform – https://github.com/UBC-CIC/health-platform
iOS watch app – https://github.com/UBC-CIC/health-platform-iOS-watchOS
Arduino Sensor – https://github.com/UBC-CIC/health-platform-arduino
Acknowledgements
First Place: Global Leadership Institute
Thank you to our AWS Mentor Volunteers Godot Bian and Tom Jin, for their contributions to this project.
Photo by Alexander Sinn on Unsplash.
About the University of British Columbia Cloud Innovation Centre (UBC CIC)
The UBC CIC is a public-private collaboration between UBC and Amazon Web Services (AWS). A CIC identifies digital transformation challenges, the problems or opportunities that matter to the community, and provides subject matter expertise and CIC leadership.
Using Amazon’s innovation methodology, dedicated UBC and AWS CIC staff work with students, staff and faculty, as well as community, government or not-for-profit organizations to define challenges, to engage with subject matter experts, to identify a solution, and to build a Proof of Concept (PoC). Through co-op and work-integrated learning, students also have an opportunity to learn new skills which they will later be able to apply in the workforce.