People Density Meter: UBC Orchard Commons Residence
Project phases
The University of British Columbia Food Services builds a prototype that demonstrates how live queue information could be captured so that student residents could plan their visits to the dining hall.
Today, Orchard Commons residents go to the dining hall and, especially during peak times, potentially have to wait in line before accessing the dining room. The UBC Cloud Innovation Centre (UBC CIC), in partnership with UBC Food Services, developed a limited proof of concept that focuses on the Orchard Commons dining hall and its entrances and food station lines.
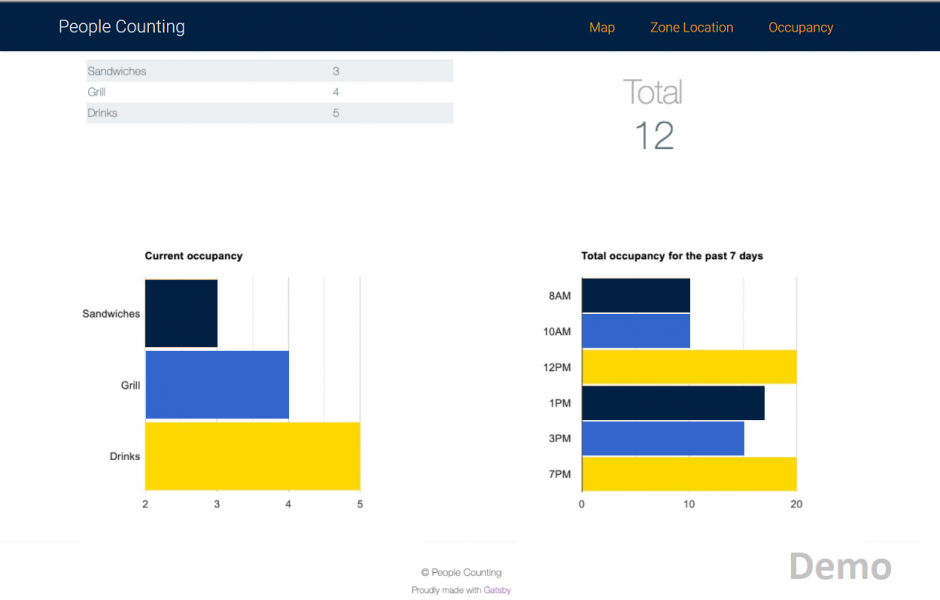
The prototype demonstrates a solution that can count the number of people in each food station line-up and update to a public-facing web page, so students can see from their computer or device that the dining hall is busy at a certain time and plan their visit for another time. Additionally, students could view historical information to inform them when peak times are likely to occur.
Approach
UBC recognized that student residents have no way of accessing information about line-ups and wait times beyond guessing or checking in person. If a student went to the dining hall and saw a fifteen-minute line, they may be caught between being late for class or getting a snack from their room instead.
Before COVID was a factor, students would have generally known the peak times and planned accordingly. Now, during COVID, student routines have changed and dining room capacity is limited to meet COVID protocols, making it more difficult to predict when these busy times will occur. Student anxiety around physical distancing is an additional factor that this solution aims to alleviate, along with increasing efficiency and convenience for students when obtaining their meals.
The UBC Student Housing and Community Services team collaborated with the UBC CIC to develop a prototype that gathers live information using Raspberry Pi camera technology and Amazon Web Services (AWS) to inform administrators and students about occupancy within a physical space. The solution would allow an administrator to view an area (e.g. line up for a serving station) with the Raspberry PI camera and designate specific areas in the image in which to count people.
The solution then monitors the movement into and out of designated ‘zones’ surrounding dining stations within the servery and counts how many people are in each zone. This provides a measure of occupancy to help staff manage the number of people in the servery and informs students if the servery is busy in near-real-time. The number of people in the each zone, along with historical charts, showing previous queue lengths for that time period are also published.
**The images that the camera captures are not saved, which protects student privacy by only recording and displaying the number count of how many people are present.
Links to solution on GitHub:
Administration website and backend: https://github.com/UBC-CIC/people-counting-with-aws-rekognition-Admin-Website/
RaspberryPI Imaging and Provisioning: https://github.com/UBC-CIC/people-counting-with-aws-rekognition-RaspberryPi-IOT
Supporting Artifacts
Architecture Diagram
Technical Details
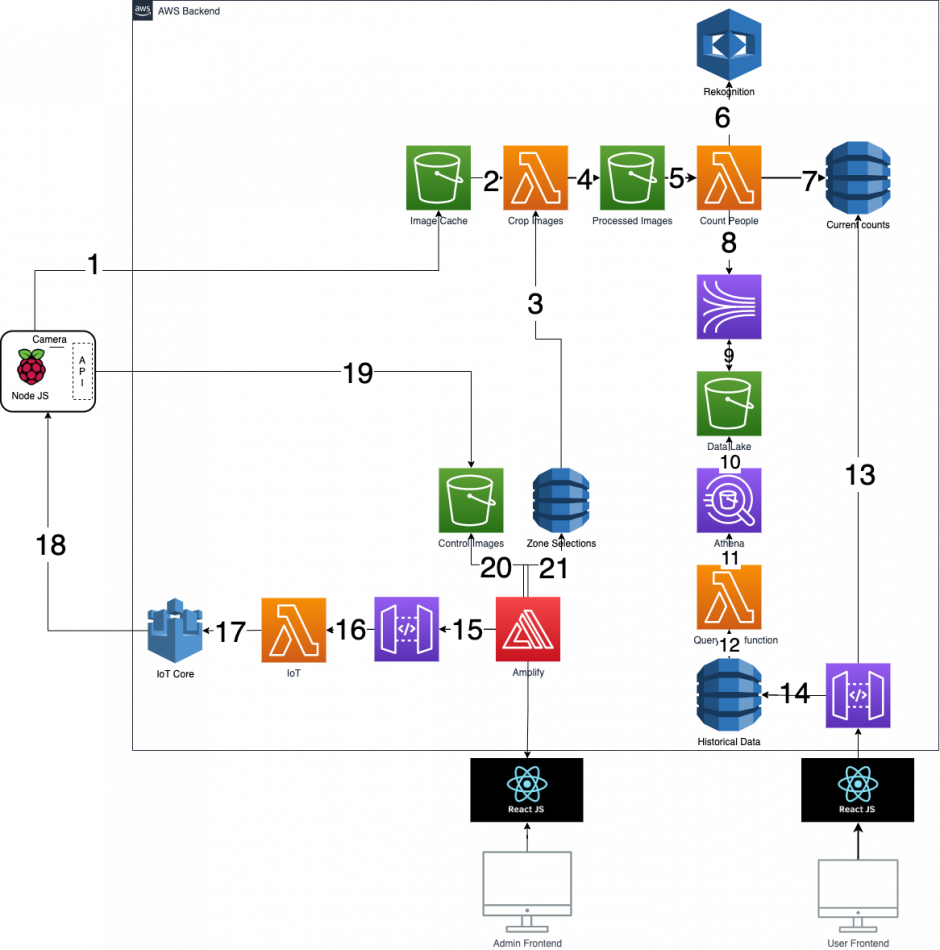
This solution consists of three major parts. The numbers shown on the architecture design below specify the flow of data as it gets processed by those parts.
Image processing part
- An image of the monitored space is sent from Raspberry Pi to the “Image Cache” S3 Bucket (all images are deleted within a fixed interval minutes after they are sent and server side encryption is enabled).
- The “Crop Images” is a lambda function which runs after the image is received in the storage.
- The “Crop Images” function crops the image using the “Zone Selections” DynamoDB table which contains zone selections.
- The “Crop Images” function puts the cropped parts of the original image into the “Processed Images” S3 Bucket.
- This triggers the “Count People” function which is responsible for counting the number of humans on the cropped parts of the original image.
- AWS Rekognition is called. It returns types of objects depicted in the image along with the counts for each object type.
- The “Count People” function puts the count for each zone into the “Current Counts” DynamoDB table.
Analytics Part
- The “Count People” function also puts the count for each zone into the analytics pipeline.
- This data is stored in the “Data Lake” S3 Bucket in JSON format.
- AWS Athena queries the storage from the previous step.
- The query is specified in the “Query function” lambda. This function is called every 24 hours to update the average count for the entire monitored space for each hour of operation over a period of 7 days.
- The result of the query is stored in the “Historical Data” DynamoDB table. This contains the average counts mentioned in the previous step.
- An HTTP request can be sent to a REST API endpoint by a client application (e.g. React.js) to retrieve the data from the “Current Counts” DynamoDB table.
- An HTTP request can be sent to a REST API endpoint by a client application (e.g. React.js) to retrieve the data from the “Historical Data” DynamoDB table.
Administrator Part
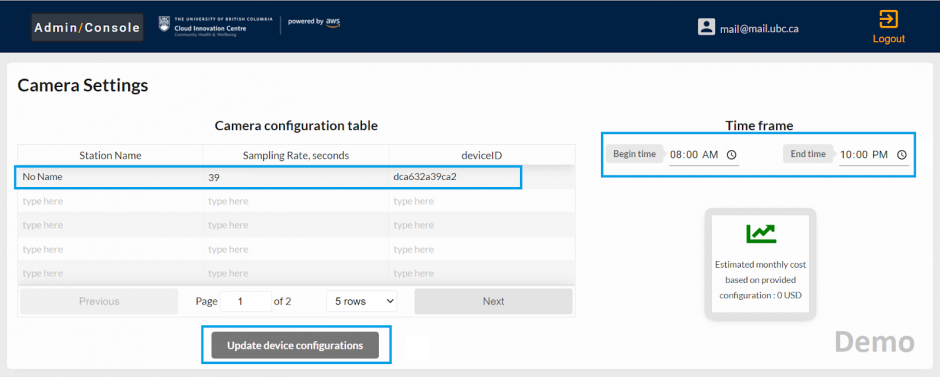
- A request to capture an image of the space from all cameras and send them to the administrator is sent from the administrator website. This is done by sending an HTTP request to a REST API endpoint from the admin website. Same endpoint can be used to update the configuration (e.g. sampling rate) for all devices.
- This triggers the “IoT” lambda function which contains the logic on how to deal with the request parameters.
- The “IoT” lambda function calls the AWS IoT service.
- This service sends a request to capture and send an image of the monitored space to all of the cameras.
- After receiving the request, the images are sent to the “Control Images” S3 Bucket.
- The images (labelled with the cameraIDs) are seen by the administrator who makes the zone selections that are stored in the “Zone Selections” DynamoDB table. Each image is labelled by the admin.
- The zone selections are updated.
FAQs
Q: Where do I find the information about how long the wait is?
A: UBC will publish the information on a public website associated with Food Services. The final URL is not yet determined. When it is available, it will tell you how many people are in the queue for each serving station so you can decide if you want to wait in that line.
Q: How often are the queue lengths updated?
A: The count updates every few minutes.
Q: Are you tracking when I go to the dining room?
A: No, not at all. The solution uses cameras to detect how many people are accessing any individual station in the dining room, while protecting student privacy by only capturing and displaying the number count of how many people are present.
Q: How are you maintaining my privacy?
A: No personally-identifiable information about you is collected. Only a number count is processed and images are not stored or retained.
Q: Can I use this information to help me skip the line?
A: This information can help you see how long lines are so that you can decide if you want to choose a different food item, a different line, or an alternate time to visit the dining hall.
Q: Why don’t you have the wait times for every residence dining hall?
A: Currently, Open Kitchen is the busiest location. While it is not in every dining hall, the opportunity to expand it to other dining locations will be considered.
Q: Is there a wait time for the grab and go service too?
A: Yes, there is a wait time, due to the fact that there are currently capacity restrictions for the service space. This service point is still the quickest option and does not typically experience lengthy delays.
Q: How would this information be displayed? Will there be screens in/outside the dining hall or only on mobile?
A: Currently, this will only be available on a mobile or desktop application. Any screen application will be used to assist staff who are monitoring the guest flow at the entrance. A screen display for guest use did not fully address the challenge of having to physically visit the dining hall space to see how busy it was. By using the mobile or desktop application, a guest can check the wait times without leaving their room, study space or even from across campus.
Q: How is this being communicated to students?
A: If made available, there will be several channels used to communicate this information to students. Prior to arrival, all first year students receive several newsletters, highlighting helpful topics, tips and tricks to make their first few days, and coming months as successful as possible. Floor meetings with Residence Life staff are also great opportunities to remind students of the resources available. There are also several marketing opportunities, at point of sale and via social media, that will be utilized to spread the word and provide web links and details to guests.
Q: Will there be a pilot or beta test?
A: There would likely be a soft launch of the program.
Q: Will this actually reduce congestion in the dining hall? Will it increase it?
A: The expectation is that this system would even out the guest flow and make it more consistent over peak periods, potentially eliminating the large peaks and valleys in guest count that is currently being experienced.
Q: Does the solution pick out people that are using furniture? Is it the head that gets counted? Or does it look for arms and legs?
A: The solution is able to recognize people who are seated and does not rely specifically on arms, legs or faces.
About the University of British Columbia Cloud Innovation Centre (UBC CIC)
The UBC CIC is a public-private collaboration between UBC and Amazon Web Services (AWS). A CIC identifies digital transformation challenges, the problems or opportunities that matter to the community, and provides subject matter expertise and CIC leadership.
Using Amazon’s innovation methodology, dedicated UBC and AWS CIC staff work with students, staff and faculty, as well as community, government or not-for-profit organizations to define challenges, to engage with subject matter experts, to identify a solution, and to build a Proof of Concept (PoC). Through co-op and work-integrated learning, students also have an opportunity to learn new skills which they will later be able to apply in the workforce.
Header photo credit: Hover Collective / UBC Brand & Marketing