The Sea Around Us in The Cloud – Phase 2
Project phases
- Phase 1 - The Sea Around Us In The Cloud
- Phase 2 - The Sea Around Us in The Cloud - Phase 2 (current page)
Sea Around Us (SAU) is an international research initiative at the University of British Columbia that acts as a critical resource to assess the impact of fisheries on marine environments. SAU has been collecting fisheries-related information from every maritime country since fisheries reporting started in the 1950s.
This data is available on their website, and is accessed by government subsidiaries, marine biodiversity groups, NGOs and scientific colleagues for conducting research. In addition to data access, the SAU also offers visualization of geospatial data through interactive maps on their website.
Currently, the SAU website allows mapping the catch of fishing countries at a granular cell level. SAU seeks to broaden the impact of their geospatial functionality by offering an interactive way to map exclusive economic zones (EEZ) and large marine ecosystems (LME), and by allowing users access to additional analyses and data filtering options. Providing access to these analytical tools will be helpful to researchers in uncovering patterns and trends at a broader scale.
Approach
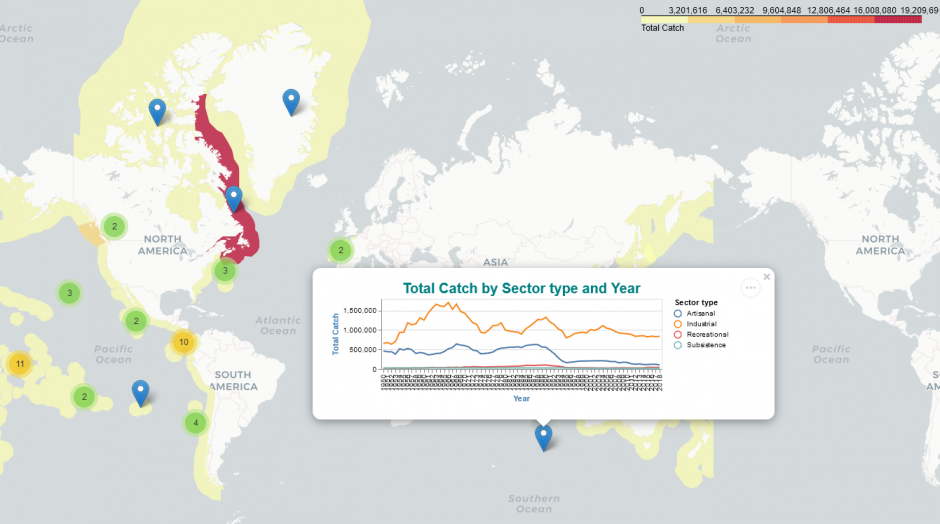
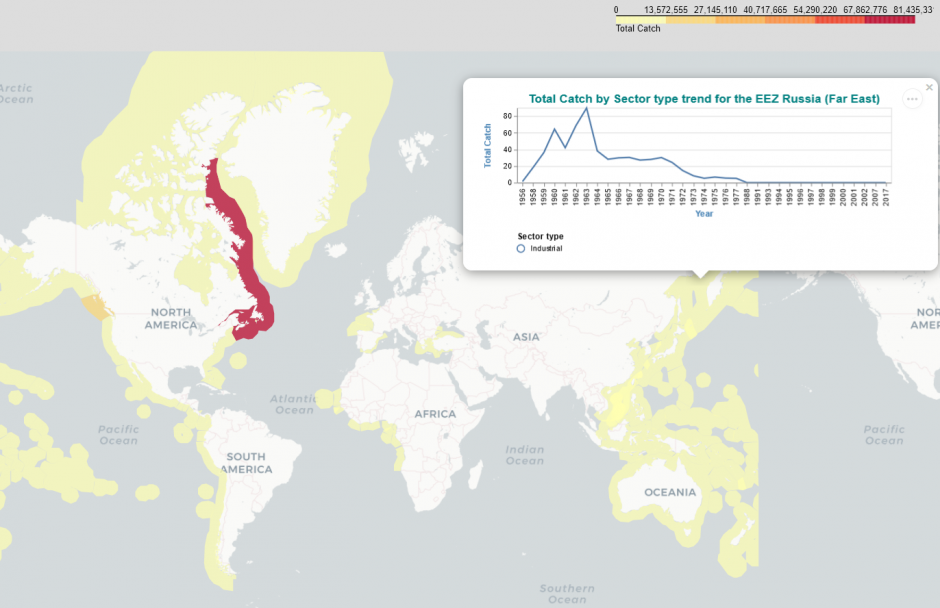
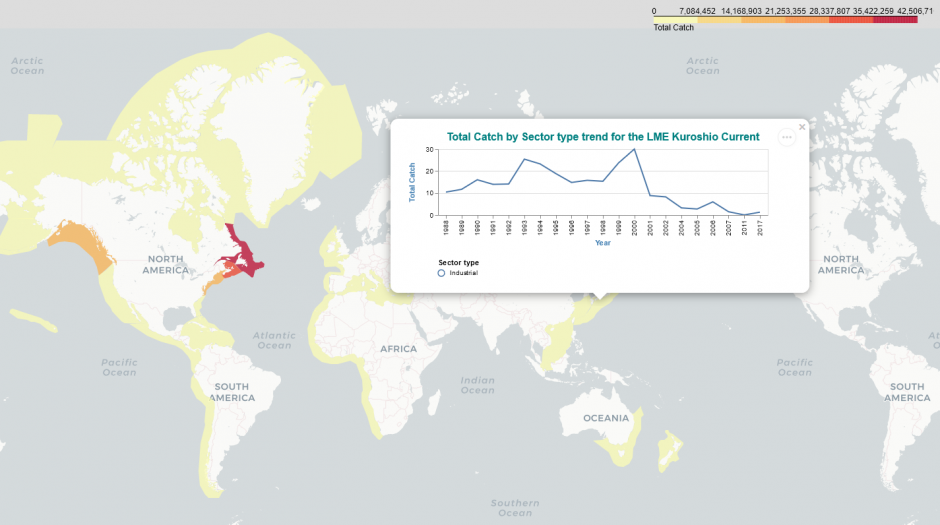
SAU, in collaboration with UBC Cloud Innovation Centre (UBC CIC), developed a solution that leverages Jupyter notebooks and AWS services to broaden the impact of their geospatial functionality. The proposed solution extends the current functionality provided on the website by offering interactive maps of exclusive economic zones (EEZ) and large marine ecosystems (LME). Additional data filtering options that are unavailable on the website are also provided in these notebooks. Moreover, enabling new views of data such as distribution of catch by sector type gives the users more flexibility in conducting meaningful analysis and research. This approach enables researchers to uncover patterns and trends of larger geographic regions while also allowing greater flexibility in conducting research.
The UBC CIC team cloned their postgres database and exported it to Amazon S3. After pinpointing the subset of data required for the project the team used AWS Glue to identify the data schema. An Amazon Athena query looking at multiple data tables was utilized to produce the sub-set of data that powers the Jupyter notebooks along with other reference tables and shape files stored in Amazon S3 and exposed via Amazon CloudFront.
These Jupyter notebooks provide users with data analysis, maps and visualizations examples, complete with the code behind the scenes. Different types of analysis tools available in these notebooks include (i) Dataframes that present the analysis in a tabular form (ii) Stand-alone visualizations to display the catch distribution and trends (iii) Interactive selection widgets to customize visualizations and maps (iv) Charts embedded within the maps itself for economic zones and LMEs (v) Heatmaps and Choropleth maps at both cell level and EEZ (or LME) level.
Instructions are added in the notebooks that explain the context and implementation details of the code blocks. User guides, additional documentation, and other reference material are also provided in the GitHub repo to help the users understand the workflow easily, and to make changes as necessary for drawing insights from data.
Technical Details
The solution aims to broaden the impact of geospatial functionality offered by SAU using AWS services and interactive Jupyter notebooks. Two different notebooks are provided to enable analysis of geospatial data at an exclusive economic zone level and at a large marine ecosystems level. As this proposal involves providing access to more details and granular data compared to the website, users are able to select only one fishing entity at a time. Users can choose fishing entities from a list, and the Jupyter notebooks will only load the data related to that selection. For example, when a user selects Canada as a fishing entity – catch data for all the EEZ (or LME) and half degree cells related to Canada will be available for users for further analysis and visualization.
Maps are created using the Folium package, which builds on the data wrangling strengths of the Python ecosystem and the mapping strengths of the leaflet.js. Users are able to bind catch data with interactive heatmaps and choropleth maps using this mapping library. Moreover, IPYwidgets are added in the notebooks to allow users to update the data sent to these maps using selection dropdowns. Researchers are able to create and customize the maps & visualizations within the notebook itself while adding interactivity with the help of data filtering widgets.
Link to solution on GitHub: https://github.com/UBC-CIC/Sea_Around_Us_Spatial_Catch
Acknowledgements
The Sea Around Us is supported by the David and Lucille Packard Foundation, Marisla Foundation, MAVA Foundation, Minderoo Foundation, Oak Foundation, Oceana, Paul M. Angell Family Foundation, Pew Charitable Trusts, and the Bloomberg and Rockefeller Foundations via RARE.
Photo provided by The Sea Around Us.
About the University of British Columbia Cloud Innovation Centre (UBC CIC)
The UBC CIC is a public-private collaboration between UBC and Amazon Web Services (AWS). A CIC identifies digital transformation challenges, the problems or opportunities that matter to the community, and provides subject matter expertise and CIC leadership.
Using Amazon’s innovation methodology, dedicated UBC and AWS CIC staff work with students, staff and faculty, as well as community, government or not-for-profit organizations to define challenges, to engage with subject matter experts, to identify a solution, and to build a Proof of Concept (PoC). Through co-op and work-integrated learning, students also have an opportunity to learn new skills which they will later be able to apply in the workforce.